Update: This transcript has been updated to reflect current AP Stylebook guidelines.
Amantha Dickman, News Director: You’re listening to “KZUM News” on 89.3 KZUM Lincoln and KZUM HD.
[Fades in on the “KZUM News” program music, an original production of Jack Rodenburg. The music fades out.]
Amantha Dickman, News Director: Good afternoon and welcome to today’s edition of “KZUM News,” an hour dedicated to learning more about what is going on in Lincoln and the surrounding areas. I am the News Director, and your host, Amantha Dickman.
We have a busy day ahead of us, so I’m not going to waste any time.
To start off our relatively breaking news this morning, the Lincoln-Lancaster County Health Department announced on August 23 that the Covid-19 risk dial will be moving to elevated yellow after being in low orange for six weeks.
According to their statistics, cases continue to decline and wastewater surveillance has shown a decrease in virus particles. Of course, the Lincoln-Lancaster County Health Department continues to encourage community members to take precautions to prevent the spread of Covid-19 and get vaccinated or boosted, if possible.
Next, in an August 24 press conference, President Biden announced plans to extend the student loan payment pause through December 31 and expanded on plans to provide student loan relief for qualified individuals.
Borrowers do have to meet a list of criteria. Among those specifications, only those with federal student loan debt are eligible for this relief program. The individual’s income must be less than $125,000 or less than $250,000 for married couples.
Anyone who meets those benchmarks qualifies for $10,000 in student loan forgiveness. If you were also a Pell Grant recipient, you qualify for $20,000 in forgiveness.
As we wrap up today’s relatively breaking news, I just want to remind you that links to President Biden’s student loan relief plan are available in today’s transcript. You can learn more there.
With that out of the way, we have an entire special dedicated to the August 22 Heuermann Lecture “Space for AG: Nasa Satellites and Science to Support Food and Water Security.”
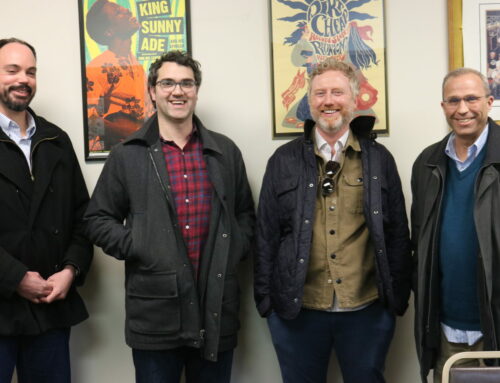
This lecture features keynote speaker Dr. Karen St. Germain, the Director of the Earth Science Division at NASA. Following her address, Mark Svoboda, the Director of the National Drought Mitigation Center, will act as moderator as a panel continues to discuss St. Germain’s work in application to Nebraska. In addition to Dr. St. Germain, this panel includes Brandon Hunnicutt, the owner of Hunnicutt Farms, and Jackson Stansell, the CEO, and founder of Sentinel Fertigation.
Without further ado, let’s hear from Dr. St. Germain.
Greg Ibach, Undersecretary in Residency IANR: This is our 11th season of Heuermann lectures, and this is the kickoff lecture for this season.
As of this morning, I was gonna be watching from the crowd, just like you guys, but Mike is under the weather today, so he’s unable to be with us.
So I get the privilege of welcoming you to this Heuermann lecture that is a “Space for Ag: NASA Satellites and Science to Support Water and Food Security.” And, so, I bet a lot of us, when we think of NASA, do not think of agriculture as connected to NASA. I think after today’s conversation, you’ll all think about NASA and ag together, when you hear NASA in the future.
These Heuermann lectures are sponsored [by] Keith and Norma Heuermann of Phillips. They’re not able to be with us here today, but they’re watching. And let’s give them a round of applause for the 11 years of support that they’ve shown to this lecture series has enabled the Institute of Agriculture and Natural Resources to focus on a wide variety of subjects.
I see a lot of you here that have come probably pretty religiously. There’s maybe some of you that haven’t missed a lecture over these 11 years. But this allows us to discuss timely topics in-depth and get insight that we normally wouldn’t have, from experts that come from, not the UNL campus, but from all over the world. And, so, that’s been a very exciting time.
The format of the lecture today, our keynote speaker, Karen St. Germain will give about a 20-minute talk. And then we’ll be joined by some panelists and have a Q and A session afterward.
Karen has been with us this morning here at the Institute. We spent some time with a farmer out by Wahoo. Then we were at the N Rec for a couple of hours, had a great discussion about the research that UNL is doing, how that connects to NASA/NASA assets that we actually use in some of that research. And some of the modeling we do that you’ll probably hear more about as we talk this afternoon.
Dr. Mark Svoboda will be our moderator this afternoon, and he’ll be introducing Dr. St. Germain, as well as the other panelists. Mark and I go… I think we were… I just was asking him if it was true, I think around 2002, for that drought, when he was one of the co-founders at that time at the National Drought Mitigation Center we worked together. And then through the climate assessment and risk climate assessment and risk committee that was formed by the legislation.
Roger probably remembers that. Matt regularly… It was Roger’s bill? I… that doesn’t surprise me. I should remember that. But so we worked together through there and so it’s nice to reconnect coming back here to the University of Nebraska.
As many farmers in the audience know that the USDA has been a major supporter of the Drought Mitigation Center and the National Drought Monitor. USDA has incorporated Mark’s work into federal farm programs. We no longer have to, as farmers, when we hit certain stages on the drought monitor, we don’t have to call USDA and ask them to consider approving us. There’s triggers that are hit at that point in time, based on the monitor, that automatically goes into federal assistance.
So we very much appreciate that.
And Mark has a long list of credentials. He serves on committees, not only here in the United States, but he’s on FAO committees that work with the United Nations, he’s taken the drought monitor and the expertise we’ve developed here to create the US drought monitor and helped other countries create a monitor similar to that. And so we’re very happy to have him here to moderate and connect his relationship with NASA to the relationships that we have here in the university, as well as other places.
So with that, Mark, if you’d like to come forward and take over,
Dr. Mark Svoboda, Director of the National Drought Mitigation Center: This should be an easy one to drive. It’s exciting times; school is starting but to have the NASA team, and it’s not just Dr. St. Germain, but also several of her team, some program managers, people we’ve had a relationship with over 20 years now.
This all was born out of sitting down and being a part at the invitation of NASA, at the Commodity Classic in New Orleans, a big producer-driven event. I don’t know if many of you have heard of it or been to it, but a great opportunity with NASA’s hyper wall. If you just wanna Google that, it’s pretty cool stuff.
So you know, sitting down and talking with Karen, I found out she actually started a career fresh out of grad school here at the university. In electrical engineering. And, so, let me just jump into her bio.
So, prior to being with NASA, where she is the division director of her science, right? She was the deputy assistant administrator under NOAA satellite and information service. Prior to that, she served on the space, strategic, and intelligence systems office of the undersecretary of defense for acquisition. And she has performed research aboard icebreakers in the Arctic and Antarctic. She’s flown through hurricanes, tropical storms, and she’s measured glacial ice on snowmobile traverses of the Greenland ice sheet.
So, I guess you could say Karen’s almost a sensor in her own right. So very impressive and very privileged to have her and her team here. Great stuff. I look forward to the conversation because she really wants to engage you folks and, and hear from you. What our needs are. So it’s a good opportunity to speak up on that.
Let me also take the opportunity to introduce the panelists. So we get all the introductions outta the way, and then Karen’s gonna come up and, and give her spiel. And then the panelists will have a short five minutes after that, before the Q and A.
So Brandon Hunnicutt who’s down here in the front row, owner and partner of Hunnicutt farms, also a member of the Nebraska… he’s the vice chair of the Nebraska Corn Board and also the National Corn Growers Association board of directors. So representing Nebraska well out of south-central Nebraska, mixed operation; corn, soybeans, popcorn, et cetera, constantly trying to use the latest in technology to improve efficiencies and sustainability, which resonates well with the mission of the Heuermann lecture series. It’s all about sustainability and security. So I think you’ll see that common theme woven in with all the speakers today, which will fit nicely.
If you’re thinking, “how does that fit into the Heuermann series?” I think it’s a really logical fit. Brandon’s role is to assess and implement ideas and practices in the areas of agronomy, sustainability, technology, and marketing.
As the vice chair of Nebraska’s Corn Board, he helps develop, carry out, and participate in programs of research, education, market development, promotion to enhance profitability and expand and demand the value of Nebraska corn and value-added corn products.
And then our last panelist is gonna be Jackson Stansell. A native of Alabama, so, transplanted here to Nebraska. He has, through his master’s work, developed a prototype end-time fertigation management system software. So he’s the founder and CEO of this effort. He is now also a part-time Ph.D. here at the university in bioengineering. And prior to that, he was at Harvard University in 2019 in engineering sciences. So I think you could say he’s gonna bring smart farming to us with his stuff here this afternoon.
And, with that, I’m gonna turn it over and have Karen come up. If you help me welcome her to the stage.
Dr. Karen St. Germain, Director of Earth Sciences for NASA: It’s so good to be back here in Lincoln. As Mark mentioned, I started my career here, when I was a pup, straight out of graduate school.
I was an assistant professor in electrical engineering. I started a little nascent remote sensing research program. And the only reason I left is that I got an opportunity to build a satellite system. And so I went back east and built my first satellite that launched in 2002. And it is still flying.
So, but it is great to be here. I… how many of you are wondering why someone from NASA would be here? Anybody? Yeah, a few anyway.
Yeah, most people, when they think of NASA, they think of rovers landing on Mars, or they think of the web space telescope or the return to the moon. What most people don’t know is that the planet NASA studies the most is our home planet.
And the answer is obvious, if you think about it, because NASA’s mission is about the betterment of mankind, and everyone we know, and everyone we love is right here on this planet. Right. So understanding how this planet works and helping people make better decisions, informed decisions, science-informed decisions is really what we’re about in earth science.
So the earth science program at NASA has, about today, 25 different satellites or space-based missions looking back down at the earth, measuring everything from precipitation in the atmosphere… that’s what [the] little satellite system is measuring. It’s the global precipitation mission. The lower one is the soil moisture mission called Snap. And, of course, Landsat up there, which you’re all probably very familiar with. These are just a few of the many, many missions that we have looking back at the Earth.
We have, as I said, almost about 25 missions. We’re in the middle of building another 10 or so. And we’re planning the ones that come after that. And that’s part of the reason that I’m here to talk with you today. It takes a while to build and launch a new capability. So one of the things we wanna do is make sure that we’re building the most impactful systems for the future. So we’re all smarter 10 years from now than we are today.
And we also know that we’re seeing changes. We’re seeing changes in the water cycle and that’s leading to changes in the carbon cycle or leading to challenges in agriculture. And, you know, a manifestation of that is, in some areas, drought and, in other areas, flooding or severe weather. The image over there on the left was actually the Derecha that came through in 2020.
So one of the ways that we try to bring utility from the observations we make from space is to integrate them with crop models. So you know, as you all know, of course, a crop model factors in the genotype or what’s getting planted, where, and when, the management practices, but also the environmental conditions.
And that’s really where we come in. And I’ll talk more about that in just a little bit. So let’s see.
Can I make it go? Yes. All right.
So this is our NASA earth science fleet. These are all of the missions that we have orbiting the Earth, looking down. Some of them are as big as a coach bus. Some of them are the size of a carry-on suitcase, and we have some that are the size of a shoebox. We also have instruments on the international space station, and these are measuring things like temperature, water content, they’re measuring different attributes of vegetation, pollutants in the atmosphere, all kinds of things.
So you know what… so what’s going on here?
Well, we know, because we measure it, that the difference between the energy coming into the earth system and the energy leaving the earth system, that’s called the imbalance. We know that’s growing. That number is about doubled in the last 15 years.
So where does all that energy go?
It is mostly being absorbed by our oceans. Over 90% of it’s being absorbed in the oceans and that… I’m gonna try something else here. That energy that’s being absorbed in the oceans is getting transported all over the world by the ocean’s currents. And that is changing our weather patterns and all that extra energy in the system is what is intensifying the water cycle, as you all know, better than most, the water cycle is mostly the water that we need to live on land is originates in the oceans and it gets delivered to us by the atmosphere. right? So that cycle’s intensifying. That’s what’s leading to more drought in some regions; drier areas, getting drier maybe. And that’s creating a lot of challenges, particularly in agriculture.
So looking to the future, how do we prepare for that? How do we, how do we ready ourselves as, as well as we can?
And that’s what we’re here to talk about. By the way, that’s also why we’re seeing increased intensification and sometimes rapid intensification of tropical storms and hurricanes. We’re seeing that as the ocean’s warm, that layer of warm water gets deeper. That’s feeding more rapid storm intensification.
So what do we do?
Well, I’m gonna talk about a couple of different phases. I’m going… in the next few slides, I’m just gonna talk to you about some of the capabilities we have today that can help inform real-time decisions as people need to make them today. And then, in a little bit, in a few minutes, I’ll take a look toward the future.
So this plot is looking at monthly hail-damaged swaths across the Great Plains in the Midwest. The color coding is by month and this kind of product again, which is automatically derived from our satellite imagery, can help us really understand the patterns, the magnitude, the frequency, and the intensity of these events.
We can also monitor drought from space. This is, I’m not gonna lie, this is one of… this product comes from, mostly from, one of my favorite satellite systems. It’s really cool. What it does, it is a pair of satellites that fly in formation and together they can detect very minute changes in the Earth’s gravitational pull right below them. And that happens when mass moves. The less mass that’s below the satellite, the less gravitational pull. Well, the mass below the satellite decreases when the water decreases. And so in this way, we can measure these minute changes in the Earth’s gravitational field, and that can tell us when water comes and goes, and we can determine the difference between root zone, soil, moisture, and shallow groundwater.
This is a new product. It’s a prototype. And this is a 14-day look ahead for soil moisture. Now, this is surface soil moisture. And this, what you’re looking at, is data from August 18. So just a few days ago. And this was the projection we made prior to that, two weeks prior, on August 4.
And, so, you can see that, you know, so this is what we predicted would happen and this is what actually happened. So, you know, as a demonstration product, we’re looking to have folks give this a try and let us know if it’s useful to them in terms of their planning.
The Ogalala aquifer. So the same instrument, the same system that I mentioned, this gravitational system, it can also see changes in aquifer status basically. So on the left, you see, this is the USGS product looking at depletion of the Ogalala aquifer based on wells and, on the right, you see the product that’s based on our satellite system. And we know that when we assimilate the satellite data into the models, we do a much better job of predicting and understanding what’s happening with those water levels.
This is another fairly recent product it’s called Open ET; it’s based largely on Landsat data. And it gives you field-level of evapotranspiration estimates. It’s freely available. And, again, we’re just… it rolled out, well, within the last year. So we’re still getting feedback on this. But this is the kind of information that we try to make freely available based on the satellite systems that we build.
Now, how about looking further into the future?
All right, so this is corn. Sorry. Corn is in yellow. Soy is in green. This happens to be in Iowa. The intensity, the brightness of each pixel is proportional to our predicted yield. And what we did was we developed a crop model again, that integrates information about what got planted, how it was managed, and then used our environmental information to predict the yield.
And then we compared to what actually happened and most of our data was actually at the county level, but it compared pretty well.
So why might that be useful?
Well, it might be useful if you wanna look ahead. Right? So that’s what we’re doing here. For corn and wheat, we take our climate models which give us a statistical forecast of temperature, and rainfall, and so forth into the future. And we use that as the input to the crop model. Now for this run, we assumed that genotype and management practices were held the same. And so the only variable is how the heat and water primarily are going to change.
But what this shows you is the stress that we’re going to start to see in corn yields, or we would start to see in corn yields if we didn’t make any adaptive measures, around the world and largely close to the equator. Conversely, wheat yields in this model do pretty well.
Now I wanna be really clear.
This is not a prediction. At all. Right?
We are… producers are already adapting what they plant, where they plant it, how they manage it. So it’s not a predictive tool. But it is a projection tool that allows you to now start running if-then scenarios against what we think are going to be the growing conditions in the future. So, again, this is a new tool that we’ve been developing with folks in the agriculture community to start testing these kinds of ideas.
So this is my last slide. And this is just to show you… each one of those dots represents a different observation that’s being made by a different NASA satellite. Some of them are of the ice in the Arctic, the atmosphere, the oceans, vegetation, soil moisture, but we’re doing our best to characterize the entire earth as a system. And then bring that understanding to help tackle local challenges.
And so we’re here today and, quickly now, we’re going to get to the panel discussion to really talk about how we can take what we do at the global level and at the regional level and make it impactful for people making decisions at the local level.
And that always, always, always happens through partnerships. Through the people who live and work here, who know the most about the practices and the conditions and so forth. So, with that, I really look forward to the conversation with my fellow panelists. And, after the initial panel discussion, we’ll bring a couple more of our NASA experts up and we’ll have a good Q and A period.
Thank you.
Amantha Dickman, News Director: That was the latest Heuermann lecture’s keynote address given by Dr. Karen St. Germain the Director of [the] Earth Science Division at NASA. We’re going to take a quick break but, afterward, we’re going to hear from the panel at the Heuermann lecture to see how Dr. St. Germain’s work applies to Nebraska.
[Fades in on the “KZUM News” between-segment music, an original compilation by Jack Rodenburg. The music fades out on the commercial break. Once again, the music fades in on the “KZUM News” between-segment music.]
Amantha Dickman, News Director: Welcome back to “KZUM News”
Before the break, we heard Dr. Karen St. Germain’s keynote address at the August 22 Heuermann Lecture. With the keynote address concluded, we’re going to get insight as to how Dr. St. Germain’s work is applied to our local communities.
Dr. Mark Svoboda, Director of the National Drought Mitigation Center: Thank you, Karen.
Okay. So it’s always hard to follow the NASA person and their graphics, so I’m gonna try my best.
But I think it’s a good segue [to] what I’m gonna talk to you about. So Karen already touched on the scale and I’m gonna try to show some applications of NASA data parts, I guess the fruit of those collaborations you just spoke of. And some of the efforts that have resulted out of that collaboration here at the University of Nebraska. And that’s beyond just the drought center.
So, to set some overall context, you know, our work is global. I know that ‘N’ stands for the National Drought Mitigation Center, but really we work here in Nebraska, so the unit could stand for Nebraska, and we work internationally. Brad Dorn would say the N stands for knowledge, but we won’t go there.
So these are some of the issues we deal with now. Here, in the United States, we’ve seen some of the issues that can arise also from the supply chain. Covid-19’s given us a good glimpse of what developing countries have gone through when it comes to getting food, healthcare, everything else delivered out on the ground in developing countries.
So there’s a lot to motivate us. And how do we better monitor those countries that don’t have the luxury of the institute networks that we have here, don’t have a luxury of free data? And how do we do that? We integrate in a lot of NASA data. And from some of the European space agencies, as well, to augment those institute networks.
And so I’m gonna show you a few things here as we go forward.
But drought is different than all the other hazards. It’s got a lot, a potentially large spatial footprint and a really potentially long temporal footprint. It can… you know… floods, hurricanes, tornadoes. Think about it. Pretty small footprint, pretty short-lived. Then they’re gone. Droughts can cover millions of square miles or hectares and can last months, years, or decades. We’re seeing this in the Western US right now. We’re not immune to it here in the United States. The drawdown of lake Mead and Powell is alarming. The river was already overallocated. There’s no more room for any more straws in the drink. So we’ve come a long way [in] monitoring drought.
This was one of the first drought maps out there. This was hand drawn, probably based on agricultural reports in from the US Department of Agriculture. And, ironically, a lot of the Drought Mitigation Center’s work and funding, these days, comes from the office of chief economist. This was from the Bureau of Ag Economics. So they’ve had a lot of skin in the game on drought before it kind of migrated out of the weather bureau within USDA into NOAA.
So, there’s a good example of the drought of 1934. Greg, do you remember that drought? Well? Out there, around Sumner?
This became the state of the art in the fifties with the advent of the Palmer Drought Severity Index, but it was really the only show in town. One index, very course resolution. Those are called climate divisions, which are really crop reporting areas for a lot of the states, not all of them, but they mimicked a lot of what was coming out of the lineage of the USDA, cuz Wayne Palmer worked in the weather bureau there at the USDA. So very coarse resolution, right?
Well, this is when we came along and worked on this new product called the Drought Monitor, which has evolved a lot from that first day. That was not done in GIS: Geographic Information System. That was truly, truly hand-drawn. Won’t even tell you the package cuz it’s kind of embarrassing. But we’ve come a long ways.
This is the map where we are today and how it’s made is immensely different. We had five or six inputs when we started in the late nineties and now we have over 50. And you can see the degree of resolution is thanks to improving our accuracy, is augmenting our institute network, which will never have enough of, never have a dense enough network, ever have it spatially perfect the way you would want it optimally.
So we use satellite data and models to augment that institute network. But we need both. The institute data validates the NASA products that Karen just showed.
Can we trust them? Can I trust them where I don’t have any data because I know they perform well where I do have data?
Same with the models, the land data simulation system models.
Gonna show you examples of these in a minute. So this is our state of the science. This is hosted here at the University of Nebraska at the Drought Mitigation Center. We’re in school [of] natural resources. But it is a partnership with USDA and NOAA up front. So the authorship rotates between those groups.
And what we’re trying to do is capture the elements of the hydrologic cycle. So a lot of those products you just saw, fit a piece of this hydrologic system, particularly on the groundwater. You know, the Grace advent, in fact – a little factoid – we worked with Matt Rodell, Dr. Wardlow, Dr. Tsegaye Tadesse, myself, the drought center team, and others, on the Grace, validating the Grace, you connected from a drought perspective, did a lot of iterations in the early stages of Grace to get it where it is now. And we actually host the website for NASA on that particular product. And so that’s a real privilege to do that in partnership with NASA.
So the drought monitor is much, much more than just what’s falling out of the sky and precipitation. We have to monitor the effectiveness of the rainfall into the soil, to groundwater stream flows, et cetera, snow packs huge in the west, right? Snow water equivalent.
Satellites help us monitor and cover a large area to do just that. We have to cover 50 states in two and a half days. Years, like this year, that’s a real challenge with about 50% of the lower 48 in drought. So it’s pretty hectic year, probably the last year like this, you’d have to go back to about 2012. Which some of you may remember that drought here in Nebraska and the central US.
To me, what’s exciting about the NASA suite is because of the flash drought in 2012, and the drought center’s been working on flash drought since 2002. We were flash drought when flash drought wasn’t cool, as they say.
We worked with many partners to develop tools, to respond to the rapid… I mean, Karen mentioned these rapid extreme events and, you know, this is a direct impact that we’re seeing from a warming world. So days in between rain events, intensity of rain when they came. My daughter lives in Dallas now. 10 inches of rain last night. I mean, cars totally covered. She’s a nurse, she just stayed at the hospital. She couldn’t get home. So we’re living it right now. We’re living it. And these tools are letting us view it right now. And we couldn’t do that on some of these things 10, 12, 15 years ago. So these tools, at the bottom, I won’t go into each of ’em, but you know, I mentioned Grace… she said gravity based. I think you were talking about Grace. I hope. All of these have helped us better monitor these rapid onset or intensifying events. Again, to get at that hydrologic cycle.
Okay. I just have, I think, two slides up.
So newer products, my team has helped develop here at the drought center newer.
I showed you that Palmer Drought Index, remember? Very coarse, climate division base, multiple county. Now you’ve got many inputs now, we can get down at that four, eight, and 12 kilometer, so we can get a much finer resolution product. We can get a more accurate product and we wanna make the drop monitor better. Because, as I like to say, someone’s always on the wrong side of the line. So we gotta make sure the line’s as good as we can get it. I don’t think you can just purely throw it all in the computer and spit out the magic holy grail number. And you’re in D two and you’re in D three, right? There’s subject matter expert[s]. There’s 450 people on the ground in each of the United States that contribute to that map. So there’s a lot that goes on behind the green curtain and making the weekly drop monitor. But I feel a lot better about the accuracy myself, when I know this stuff’s going into it.
We just started a quasi-operational flash drop plan working with partners here at the High Plains Regional Climate Center using that ASIS database funded by USDA office of chief economist. That’s a new one hot off the press. I mean, we[‘re] just looking, it’s not even out to the public yet. And, so, it was fun to watch how that worked this summer and we think it captured the patterns pretty well. The more we can do to speed up our response to rapid events, the better we can be accurate on that map, which producers rely on.
And now we’ve taken that out, I think Greg mentioned that we’ve taken that out globally, working with World Bank, working with USA, working with United Nations to develop these combined drought indicator products that these countries are now standing up as operational early warning systems. So that all started off [as] the basic science of the drought monitor evolved into more of a computer automated fashion because they don’t have institute data or very little of it. And, so, it’s very exciting and pleasing to see the applications that the drought center’s doing using data from groups like NASA and collaborations around the world.
So some final thoughts. We’ve gotta do a better job now of bringing our existing land data models and assimilation systems into the, you know, this realm, if you will. How fast can we get the data without a lag? So that’s what we call latency. If my data’s four or five days old, when I already get it… I’m making a weekly product, I’m gonna already have an accuracy issue. All right. So we’re working with NASA specifically Goddard Space Flight Center, Marshall Space Flight Center to integrate in new models on the land data simulation system and integrate those in using other data.
And it’s not just all NASA. I mean, we’re here about NASA today, but, you know, there’s a lot of skin in the game by a lot of players and a lot of agencies, but I feel these can help us better address flash drought. And as I already mentioned, then I think we can take these beyond the US and we already are. So I’m excited to see where that goes in the next 10 years as well.
And with that, I’m gonna turn over to Brandon for his comments.
Brandon Hunnicutt, Owner of Hunnicut Farms: All right. Thank you very much.
You know, from a farmer’s perspective, it’s really, really great to be here. Especially one from Hamilton county who, you know, it’s great to have Keith Heuermann sponsor this just for the great work he did, not just for Nebraska, but in our county as well.
But there is a lot of challenges we face on the farm and there’s a lot of the things that we obviously can control; what seed we’re planting, amount of fertilizer, what herbicides we’re gonna use, et cetera. But when it comes down to water, that’s the key element that becomes the massive challenge of a great year versus a poor year. And we’re blessed because we’re fully irrigated. You know? So when droughts come in, strangely, it becomes one of, probably, the best times for us yield-wise, because what means we probably have a lot of sunshine, a lot of heat, and we can pump water.
But what we learned, from my perspective on the farm, when I came back to the farm in 1999, I believe it was, we were monitoring our soil moisture. We were doing some things, the old-fashioned way – the Handfield test – you know, trying to figure out how much we need to water, listen to the radio station, see what the et was, and learned very quickly that a lot of that wasn’t accurate. And we got more involved with that working with UNL on some very, the beginning stages of using soil moisture monitoring systems, just little soil probes that were putting out there. And they were… they worked well because they gave us the initial look at what’s going on in the soil and what’s going on in the water.
And we’ve slowly moved through that, to try to figure out how do we get to the point that we can better time and better place water. But our challenge becomes is that, if we’re using a probe where in one static point in the field, well… is that your best area, your worst area, the average area? Do you have multiple soil types, which we really don’t have in our area? So there’s something that we’re blessed with.
So we upgrade to the next platform, which is more data points as the pivot goes around. But that still becomes a challenge because you’re still in a really small area trying to figure out what’s going on.
And so we, we start looking at this of, okay, “what’s the next step we need to do?” And being able to more accurately monitor, maybe it is through satellite imagery or satellite data that we can say, “Okay, this farm, as a whole is, okay.” We don’t need to turn on the pivot yet because we realized over the years we were way overwatering. And we talked about the Ogalala aquifer, you know, without that in Nebraska, you know, we don’t have the production we currently have.
So what is it we can do to protect that?
From the perspective of looking ahead and that’s one that caught my eye, because if we have a 14-day look ahead, okay, now we can start making some decisions. And those become real decisions on whether it’s water, whether it’s fertilizer, whether it’s a fungicide, whatever the case might be… but looking at it, going, “Okay, what is it that we can do to impact the farm in a positive way?” Because we’re always trying to figure out what is the next big thing for yield. What is the next big thing to bring more value back to the farm? And all these things are fascinating because it’s that next stage. Because a lot of our challenges right now, you take… most farmers get some sort of free satellite imagery data, whatever platform they’re on. It doesn’t matter. They’ll send you something. And most of that is useless, cuz you’re like, “Hey, this area shows this field has some sort of crop mass problem.” And you’re like, “Well, I really don’t know what that is because the field’s fine. Everything’s fine.” Or they’re trying to predict yields. And I won’t name the company right now, but my yields over the last three weeks have gone up 40 bushel[s], down 50 bushel[s], no rhyme or reason to anything cuz I don’t know what they’re measuring it on. But we need those tools to be able to say, “How can we better effectively manage what we’re doing?”
But as I look at it, also, as the vice chair of the Nebraska corn board and we’re trying to figure out every year, what is our budget gonna be? And our budget is based off of production in Nebraska. Well, we’re right now… we’re kind of at, in a lot of ways, we’re kind of back in the 1950s of drawing the drought monitor of, “ Okay. What do you think? What do you think? What do you think? What do you think?” Because it’s the best tool we currently have. The challenge becomes is that if you set that budget and then a drought comes in and now you’ve got a problem; which still trying to predict yield, trying to predict what we’re gonna set our budget at. That affects a lot of things. That affects what we can do as an organization, spending money on whether it’s working with research on UNL or helping farmers find the next market development tool. And that’s a big deal because that would be really helpful if we could say, “Okay, we actually have a handle on what yield’s gonna be. So we’re not surprised.”
And then from a national perspective, we deal with a lot of farmers. We’re representing farmers. Roughly 40,000 dues-paying members. And being able to most effectively help them, as well to say, “This is what we’re looking out for. This is how we’re utilizing your dollars into a national organization to protect the way of farming.”
And a lot of this comes down to how are we gonna mitigate these risks of adverse weather factors?
You know, so whether it’s our neighbors in… our farmer friends in Ohio that were planting in June for the first time in pure mud, because it was raining too much, or the guys here in central Nebraska that held off planting by a week, not because of rain, but it was too dry and too cold.
And that affected everything up and became a problem. So how is it we can start to help the farmer in that perspective, not just on my own farm but as a farm as a whole?
Dr. Mark Svoboda, Director of the National Drought Mitigation Center: Thanks, Brandon. All yours.
Jackson Stansell, CEO of Sentinel Fertigation: Awesome. So it’s great to be here. Glad to see a lot of people in the audience that I’ve been fortunate enough to spend time with.
So I’m Jackson, Stansel, I’m the founder and CEO of Sentinel Fertigation. I’m also a Ph.D. student here at the University of Nebraska.
Sentinel Fertigation, to give you a little bit of context, we are an image-based fertigation scheduling company. So what we are really trying to do is, as Brandon mentioned, kind of take the next step beyond the free satellite imagery that a lot of growers get through various different platforms and actually take that satellite imagery and turn it into, not only insights and analytics, but also a decision recommendation that a farmer can take and essentially choose what to do with, and hopefully help them inform their management practices.
We’re also… kind of taking steps toward making headway to identifying a specific problem. And not just generally having kind of a bio mask quantification, like Brandon mentioned, which is where a lot of our satellite products has been. It’s been… you know, we can see problems in different areas of the field. But the question is until you can get out there and ground truth at what really is that problem and how do we respond to it? So the research and technology behind our company came out of my master’s work here at UNL and I won’t get too far into that… and we can maybe get to it in the Q and A if anybody is interested.
But I want to kind of look at, I guess, what I’m seeing as far as trends in the context in the agricultural industry. And so three things that I, that I’ve really been seeing over the past few weeks and really past few months and years even, is becoming big trends in the agricultural industry are, number one, regenerative agriculture.
There are a lot of farmers here in Nebraska that are starting to adopt regenerative practices. Nebraska’s been no-till for a long time. And so that’s nothing new here, but there have been a lot of cover crops that farmers have been starting to use. Farmers are starting to undertake biological fertilizers, which is totally changing how folks are doing their nitrogen management.
And, so, these have been a lot of new practices that are coming in and, really across the industry, there’s a lot of effort going into how do we quantify the impacts of these regenerative practices and kind of take us to a next step and another trend that we’re seeing in agriculture right now, which is alternative profit opportunities, is what I would call them. But they’re essentially ESG goals that corporate buyers of agricultural goods have. And they’re trying to encourage sustainable practices on the farm. As well as carbon markets and ecosystem services markets that are offering alternative profit opportunities for farmers for quantified impacts that they’re having through sustainable and regenerative practices.
Another trend that I’m seeing out there is a willingness for farmers to engage in more intensive management, to overcome a lot of the risks that we’re seeing from climate change and also some of our production practices over the past 40, 50 years with herbicides. Farmers going back to intensive cultivation to get rid of weeds, farmers going to multiple split applications of fertilizer, to both protect themselves against risk, as well as increase the efficiency and their crops.
And so these are all big things that farmers are trying to push towards. But they all come back to being able to, essentially, quantify crop production a little bit better and different things that are going on in the field. And so data is an extremely important part of agriculture at this point. And, specifically, satellite data is, as we’ve seen, I think in agriculture and across the industry, is by far the most scalable data source that we have and the one that is going to be the most readily available to make important decisions for the foreseeable future.
So in agriculture, what we really need for intensive management through monitoring and decision-making, is we need essentially the right spectral response in our satellites to be able to quantify vegetation. We need really, really high throughput data both from a spatial resolution standpoint, as well as a temporal resolution standpoint. For Sentinel, we are making decisions every single time that an image comes into our system. And so we are ingesting satellite imagery on a near daily to daily basis right now and making decisions that quickly. And our farmers are actually looking at the platform every single day to see if there’s something new that’s coming across that system. Farmers want this data and they want it in real-time.
So the way that we’re accomplishing that right now is by working with a couple of commercial partners; we’re working with Planet that’s supplying the near-daily satellite imagery at three meters per pixel resolution including both the red edge and near-infrared bands, which are critical to us for quantifying the normalized difference red edge index which is what we use to correlate back to nitrogen status and quantify crop nitrogen status. We’re also working with Airbus and we’re early adopters of their new Pléiades Neo Constellation, which is producing 30 centimeter per pixel pan-sharpened multi-spectral imagery that really allows us to do some excellent quantification of crop nitrogen status. And a lot of our farmers have responded really, really well to having that imagery in the platform, not only from a nitrogen standpoint but as well as the ancillary benefits of being able to identify sprinkler performance along pivots, being able to identify areas of their crop that have been blown down potentially by strong winds. And so there are a lot of other ancillary benefits to this imagery.
And, so, I guess I’d like to, since that was mostly just a lot of context provided there, I just want to kind of finish up with one final thought that I’ve been thinking about, especially with the Ukraine and Russia situation that we’ve all watched play out and how it’s affected agricultural markets, both from a commodity standpoint as well as from an input supply standpoint.
Agriculture and national security are not mutually exclusive. These are critically linked topics. And I think that’s a perfect reason why NASA, as kind of a, you know, a US agency should be playing in the agriculture space. And I think it’s critical to national security that we continue to improve our data sets in the way in which we can quantify what’s going on on the farm.
And, and I would also go kind of back to the Heuermann lecture mission, right? Which is sustainability and security, I believe is what I heard earlier, earlier. I think sustainability really is security, and we’ve gotta preserve our natural resources, in order to preserve really our most valuable asset as a country. And I think a lot of countries feel the same way. And, so, if agriculture has an outsized impact on our natural resources, it’s a really important thing to get right. For preserving those natural resources long term. So with that, that’s kind of all that I… I have to say. And I’ll turn it back up to Mark.
Dr. Mark Svoboda, Director of the National Drought Mitigation Center: Thanks, Jackson. And please join me in thanking the panels for their comments too.
Okay. Before I call up Brad and Forest… well, why don’t you guys come on up, Brad? And Forest? Both on NASA, we’ve got California represented and we have headquarters in DC represented. Forest is from California. And Brad’s coming in from DC.
I’d like to offer you the opportunity to carry into any quick response to anything you heard from our partners on the ground.
Dr. Karen St. Germain, Director of Earth Sciences for NASA: Yeah. I think what you both said is part of… we spent the day traveling around the area and, and talking with farmers and experts. And we heard a lot of those same themes.
So it’s taking what we can see from space, scaling it, making sure it’s accurate, and making sure it’s usable to inform decisions.
So yeah, I think your comments were really insightful and I absolutely agree with you. Part of – I didn’t really focus on it in my talk – but, yeah, that one of the great things about satellites and that unique vantage point of space is that we can see the entire globe.
And that means we have insight into what’s going on in Ukraine and Russia and so forth. And we can understand, again, not just what’s happening here, but what’s happening in other countries and how that may have an impact on what’s happening here. So, thanks.
Dr. Mark Svoboda, Director of the National Drought Mitigation Center: All right. Thank you. Thank you, Karen.
Okay. At this point, we’re gonna open it up for questions and Jesse’s gonna run around with the mic. And please identify your name if you could, for the people online as well. Thanks.
Don Nelson, Attendee: My name is Don Nelson. I’m from Lincoln. Could one of you explain or contrast the difference in the platforms and the programs that you’re dealing with at NASA and those up in South Dakota with the Aeros program?
Brad Dorn, Program Manager for the Earth Science Division at NASA: Okay. I’m sorry. Yes. I’m Brad Dorn. I’m the program manager in Karen’s program for the agriculture and application research area. So thanks for bringing up Aeros.
Aeros is a key partner of ours. We actually work with them. They are a USGS facility. And so you’ve all heard about the Landsat satellite. Well NASA develops, launches that satellite. And then when it’s operational, it turns it over to USGS. USGS then operates that satellite. But NASA does have a backup operational system and in Goddard. But we operate that satellite… USGS does out of Aeros’ data center and they store all that Landsat data. And they’re also a Daac, which is an archive partner of NASA.
So it is a USGS facility, but we have a very tight and close relationship with them. Do you me to clarify that? Anything I said on that?
Dr. Mark Svoboda, Director of the National Drought Mitigation Center: No, go ahead. Two there’s two.
Dr. Karen St. Germain, Director of Earth Sciences for NASA: Right, right. Yeah. So, so the only thing… thanks so much, Brad.
The only thing I would augment that with is… Yeah, so, I count Landsat as two, again, two of the 25 missions that I mentioned. It is a partnership mission. It’s an operational mission. So it’s very similar in some ways to the weather satellites NASA builds, the weather satellites for NOAA. It’s a little bit of a different model, but that too is a partnership.
And then within the NASA Earth Science program, we are looking to build, we’re looking to demonstrate and develop the next generation so that Landsat next is more capable than Landsat was. but we’ll, we’ll do that demonstration with the missions that we build out of the Earth Science Program to inform the next generation of operational issues.
Brad Dorn, Program Manager for the Earth Science Division at NASA: Just one thing to add. One thing that the USGS and NASA programs all have in a common is the data is freely and publicly available to all users. And one of the things I’m excited about is companies, like Jackson, starting to use and consume those products and develop applications for farmers, for producers in the field that help them manage resources in ways that reduce input cost and improve their overall profit profitability and sustainability.
Forrest Melton, Research Scientist at NASA: Oh, thank you, Brad. I’m Forrest Melton. I’m a research scientist out of NASA Ames research center, in the program scientist for the NASA of western water applications office.
Matt Hammonds, Attendee: Hi, I’m Matt Hammonds from Lincoln. I wondered if you could comment on a couple of things. The First Street Foundation’s recent report about the extreme heat zone that goes up in the middle of the US. Just commenting on that prediction of does that line with other things that you’ve seen? And then also talk a bit about the role of an organization, like First Street Foundation – which I’d never, never heard of before – as it relates to academia, government, producers, and industry.
Dr. Karen St. Germain, Director of Earth Sciences for NASA: Okay. I’m in the hot seat now.
Actually, Ed Kerns, who is well… I don’t know if he is the principal for First Street, but Ed is an old friend of mine from my NOAA days. And you know, I think, when I took this job with NASA, one of the reasons I took the job was because… or one of the, well let’s face it, one of the reasons I lobbied to get the job is because I knew there was gonna be so much demand for actionable information. So First Street is trying to fill that niche. I don’t have insight into their calibration and validation of their products. So I can’t, I can’t comment on the accuracy. But I think it is further evidence that there’s, there’s demand for information on multiple time scales, frankly. Right. The immediate two-week time scales, the seasonal and then the longer term, right?
Because decisions have to have to be made on different time scales, right? Depending on the level of investment and development. So I think First Street is one of, I think, several private sector entities we’ll see popping up that are trying to fill that need. But I can’t, unfortunately, I can’t comment on the accuracy.
Greg Ibach, Undersecretary in Residency IANR: So Jesse said that was the last question. So we’ll I’ll take my cue and And wanna thank the panelists for their time here. But you know, all good things have to come to an end, I believe. And so thank you again, and have a safe trip home.
Amantha Dickman, News Director: We are fast approaching the end of the hour, so here are your reminders for today:
The KZUM newsroom is always open to hearing about any questions, concerns, suggestions, or even any story ideas that you want to share with us. All you have to do is give us a call at (402) 474 – 5086, extension line six. If you give us a call and we aren’t available, don’t forget to leave a voicemail. Or, if you aren’t much of a phone person, you can also find our social media handles and more newsroom information at kzum.org under that ‘About’ tab.
Speaking of our website, if you happen to miss a show, you can always head to the “KZUM News” tab where we archive all of our shows and include a transcript with links to that day’s content.
And, lastly, I just want to give a shout-out to Jack Rodenburg of the Rodenburg music experience. He put together all of the amazing original music that our news program uses. So, once again, thank you, Jack.
That wraps up our reminders for now. As you head out into the world, I hope you have a lovely day. Thank you for listening and we hope you’ll join us next time.
[Fades in on the “KZUM News” program music, an original production of Jack Rodenburg. The music fades out.]
You just finished listening to “KZUM News,” an original production of KZUM radio that airs every Saturday at 11:00 a.m. Coming up next is “Beta Radio,” so stay tuned.